Estimating Low Income Fare Ridership and Covid Ridership Behavior
In hopes of better understanding how some of PPT’s campaigns change in relevance and urgency with COVID, we focused on answering these questions:
- How much pandemic era transit ridership represents low-income ridership?
- What’s the possible ridership boost to ridership with a low-income fare?
- How much would be needed to cover an emergency low-income fare program?
The process of estimating low income fare ridership relied on looking at existing research on low income ridership, the ridership shift that occurred due to Port Authority fare price changes, and EBT eligibility in Allegheny County.
Question 1: How much pandemic era transit ridership represents low-income ridership?
Lacking the literal income data of pandemic era trips, we wanted to establish reasonable ranges for low-income ridership. The low estimate comes from SNAP census data population percentages, the high estimate comes from WMATA estimates of <$30k ridership. Finally, we reference Port Authority’s own income ridership data to establish a reasonable range.
Low estimate: Using SNAP Census population data (~9.4%)
Our low estimate of EBT eligible ridership involved assigning ridership in each census tract according to their proportional SNAP eligibility. That yielded a 9.36% estimate, which represents a conservative estimate given the high correlation between EBT eligibility and transit ridership.
- Q: How many riders eligible for a low income fare live in each tract?
- # of Eligible Households: We found the number of SNAP Eligible households under 60 by census tract
- # of Total Households: We found the number of total households per tract
- % of SNAP Eligible: By tract, we found the percentage of households eligible for low income fares by tract
- Q: What is the transit usage for each tract?
- Ridership by tract: We summed the average daily rides for 2019 by stop in each tract
- Q: What’s the number of low income eligible rider trips from 2019?
- Sum of SNAP eligible trips per tract 2019 = % SNAP Eligible * # Trips per Tract = 6.2M trips in 2019
- ~6.2M trips out of ~67M total trips in 2019
- 9.36% of trips are estimated to be low income fare eligible
High estimate: WMATA’s covid-19 ridership data (~69%):
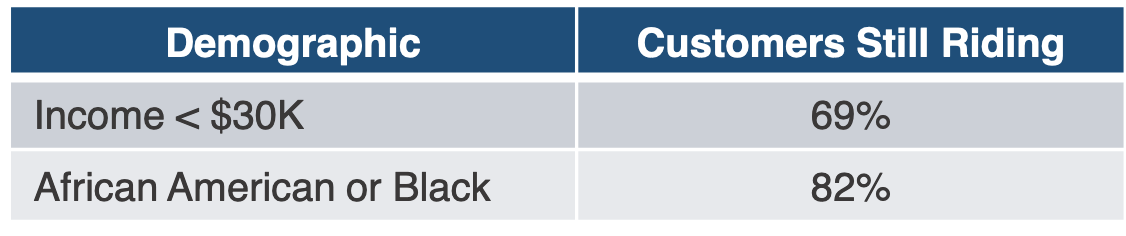
According to WMATA’s June 2020 Board Action/Information Summary, about 69% of those remaining riding were low income. However, WMATA is a very different system compared to PAAC. Additionally, the $30K cutoff might not represent the right income cutoff for a SNAP eligible household.
| PA SNAP Eligibility | ||
| Household Size | Maximum Gross Monthly Income | Yearly Income |
| 1 | $1,354 | $16,248 |
| 2 | $1,832 | $21,984 |
| 3 | $2,311 | $27,732 |
| 4 | $2,790 | $33,480 |
| 5 | $3,269 | $39,228 |
| 6 | $3,748 | $44,976 |
| 7 | $4,227 | $50,724 |
| 8 | $4,705 | $56,460 |
| each additional member | =+ $479 |
PA SNAP Eligibility by household size: SNAP Income Limits
Medium estimate: Port Authority’s income breakdown (10-30%):
PAAC June 2018 Bus Rider Satisfaction Survey
Using results from PAAC’s own income breakdown of ridership, we have see that the range of SNAP eligible incomes ($16k for a household of 1 to $33k for a household of 4) is represented in a range between 11%-67%, with likelier ranges between 11-35% of ridership ($15k-25k).
So what’s the final answer? What is low income ridership out of total ridership?
In our original conservative estimate, 10% of ridership based on census data was EBT eligible. When looking at rough income breakdowns, 35% of normal Port Authority ridership was in the <$25k range. So our estimate of low income / eligible ridership is going to be 10-35%.
Question 2: What’s the possible ridership change with free low income fares?
When we looked at the ridership loss to full fares (on similar days), an annual estimate puts that at around ~1.8m! When we looked at ridership increase with free fares, that was around 300k. So ridership increase should be at maximum 1.8M.
According to an MIT low income fare study (that looked at half fares), ridership increased by 30%! So while the % from the broad fare changes were 1.5-8%, the ridership increase is possibly higher, especially among low income riders specifically.
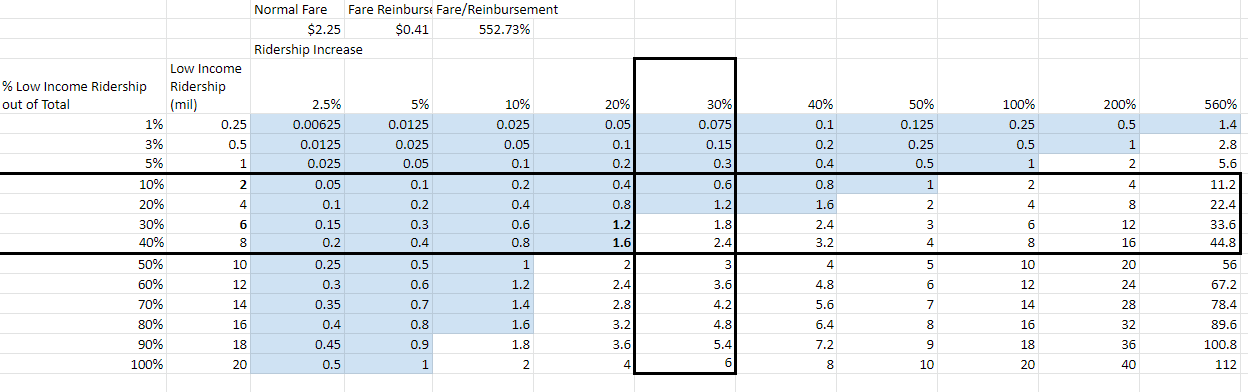
In the blue I highlighted all ridership ranges under 1.7M in blue as our possible “maximum” change. I boxed the likely EBT ridership and the 30% estimate. So we could very well look at a ridership increase around 1 mil.
Question 3: How much would be needed to cover an emergency low-income fare program?
Given our previous ranges of estimates, we can see how much a low-income fare program might cost. With fares being $2.25 and fare reimbursement being $0.41, we would need a ridership increase of 2.25/0.41 or x5.52 increase in ridership to break even.
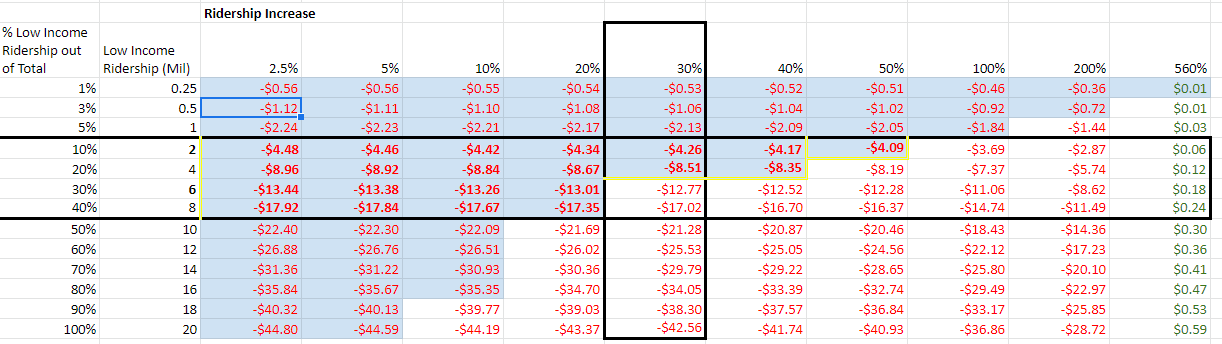
Given that it’s likely that our low income ridership is 10-40%, and our increase is at least 30%, a cost of $4M-$8M is likely.
A likely $4-8M cost should be compared to $56M total shortfall, and compared to the huge regressive cost on those who need transit most.